AI’s 2026 buildout is linking bond supply, hyperscaler cash flow and grid costs. SIAIntel maps the feedback loop and introduces the ACPI framework.
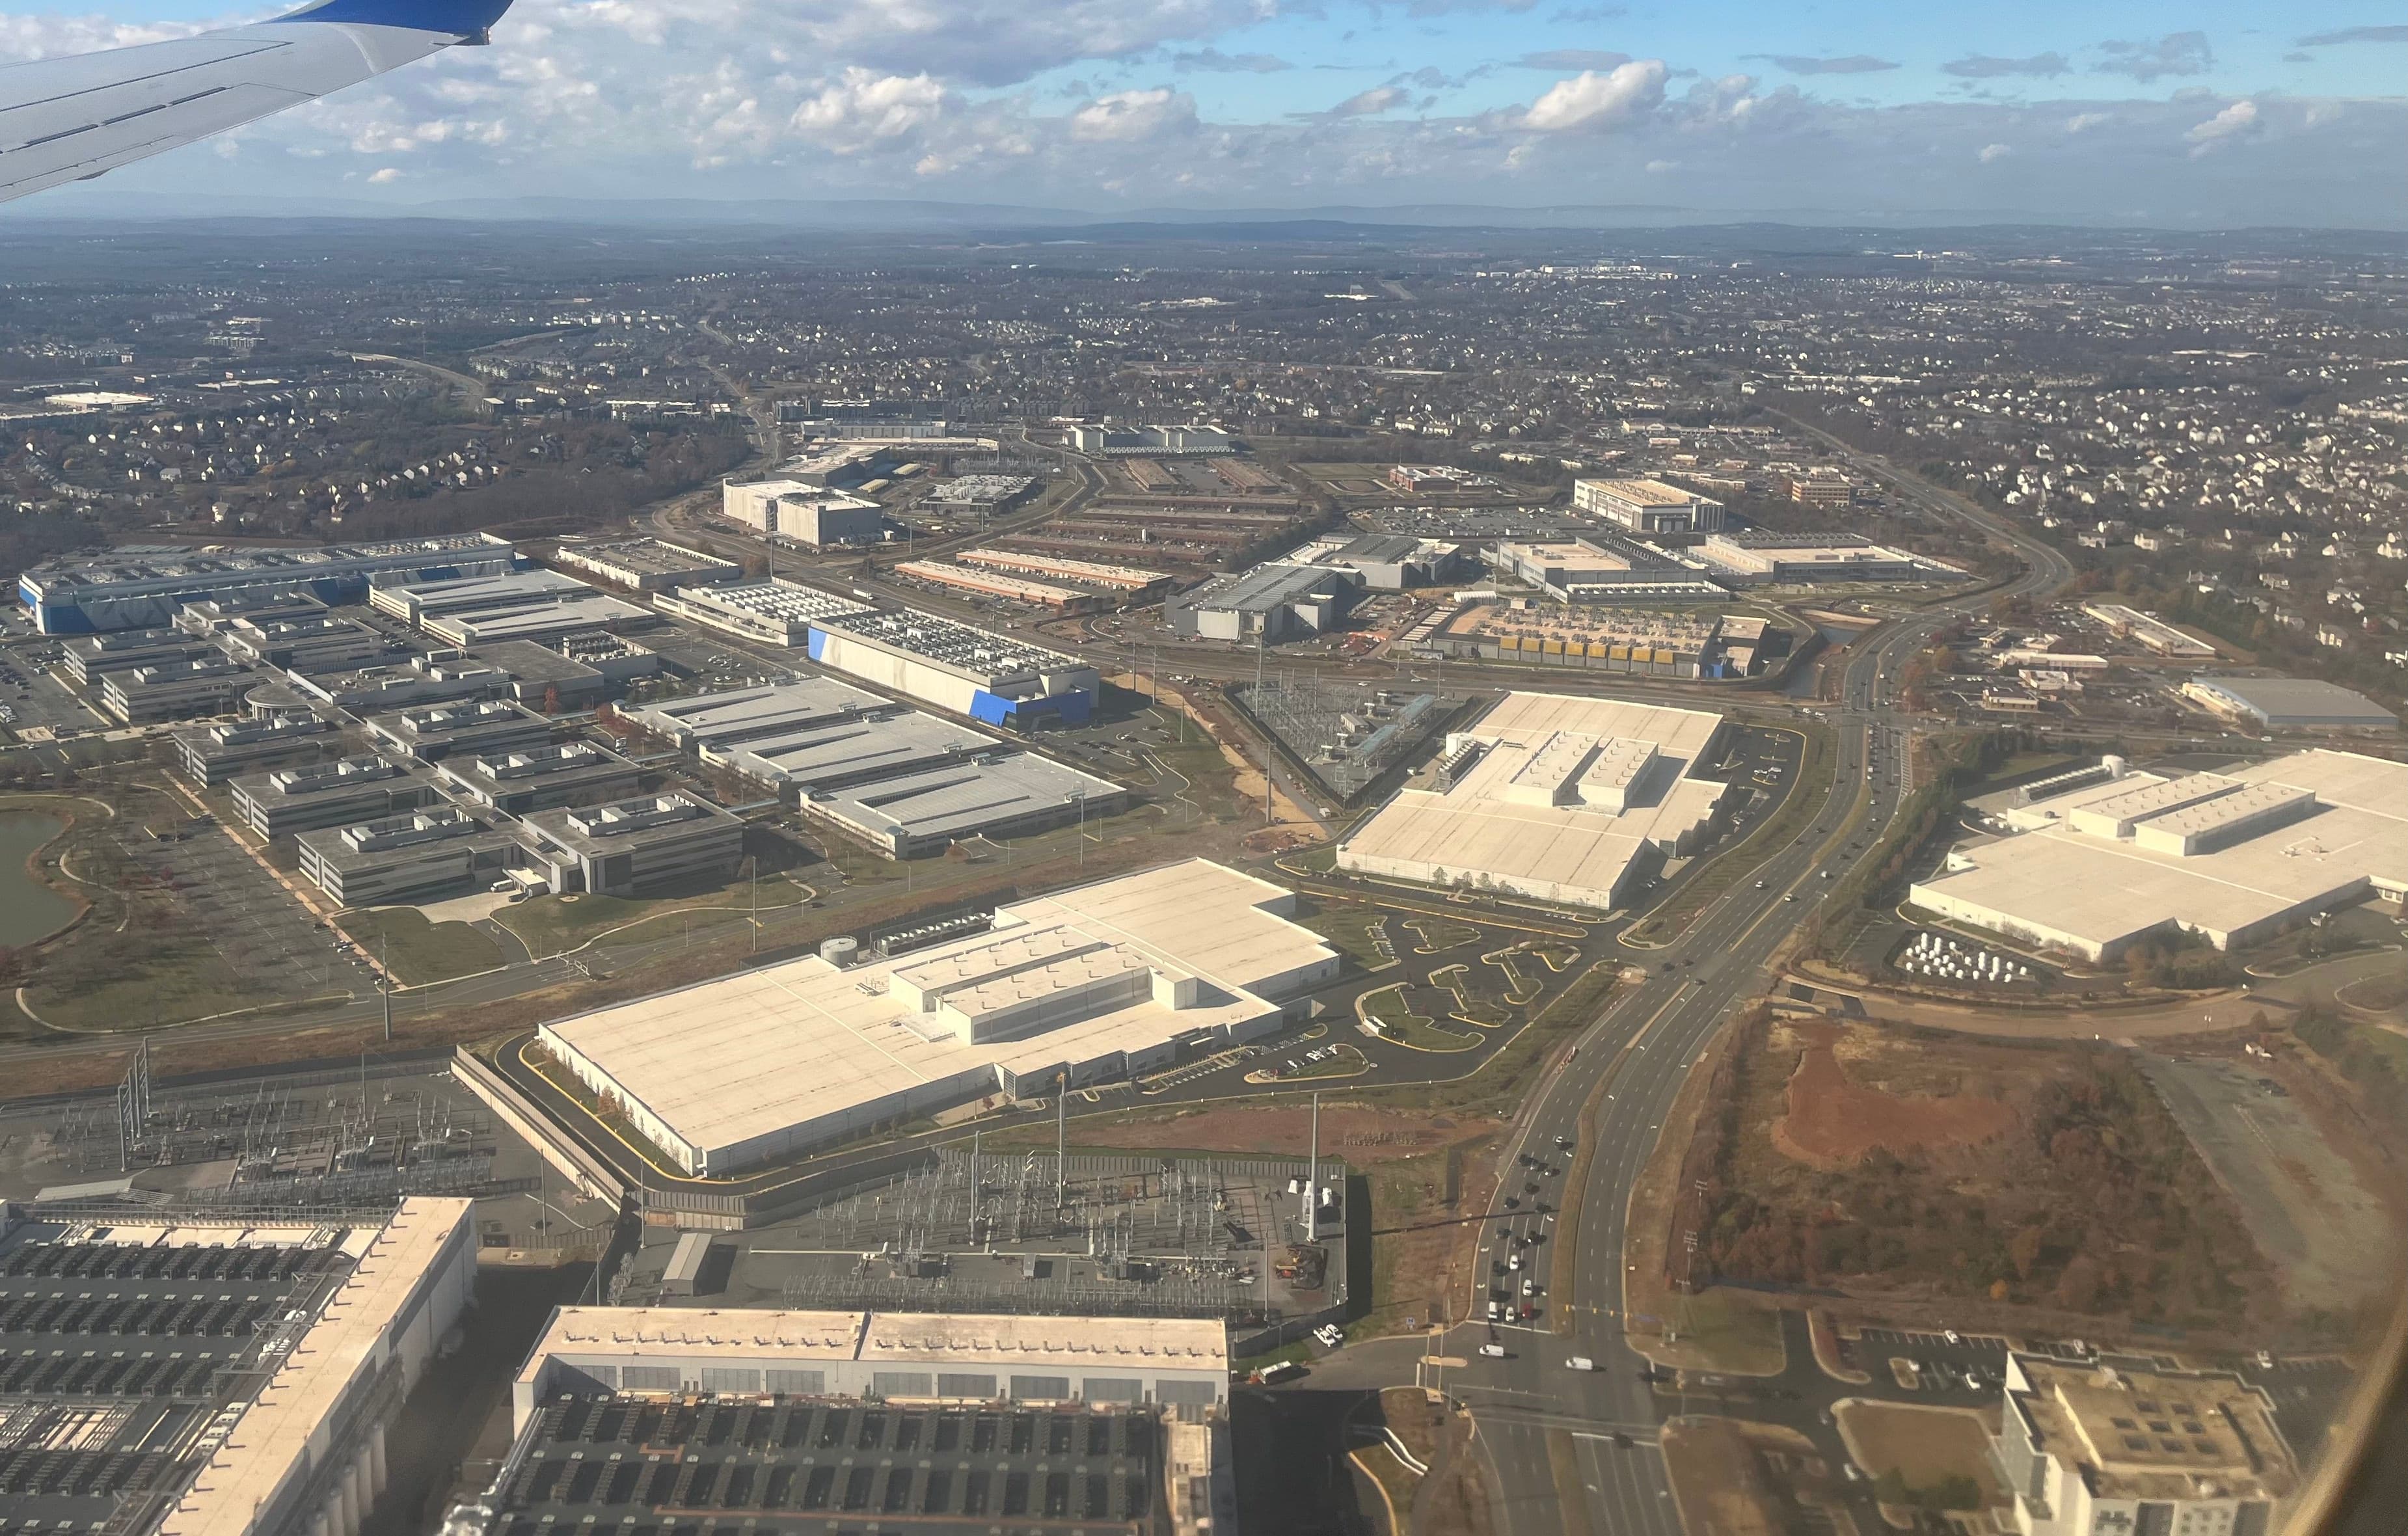
30-second signal
Reuters puts 2026 AI-linked U.S. corporate borrowing near $220 billion, while Alphabet’s Q2 filing shows $39.069bn of OCF against $44.924bn of PP&E purchases. The signal is financing intensity, not a liquidity crisis.
Meta reports Q2 OCF of $31.862bn with $30.116bn of PP&E purchases, and Amazon reports $45.4bn of quarterly OCF against $53.1bn of cash capex. The buildout is consuming a historically high share of internal cash.
Microsoft’s FY2026 Q4 disclosure confirms another large cash-capex cycle, while PJM’s independent monitor reports a 50.3% rise in first-half wholesale power cost. Capital and electricity are now part of the same physical investment cycle.
DOE documents transformer lead times stretching into years, while the SNB’s Petra Tschudin says AI can lift inflation before its productivity dividend arrives. SIAIntel therefore treats the current phase as a timing problem between construction costs and monetization.
AI investment is no longer only a technology story. The 2026 buildout is forcing the same companies to manage three scarce inputs at once: long-duration capital, reliable electricity and physical grid equipment. The central question is whether monetization can outrun the rising marginal cost of that infrastructure.
This working narrative separates balance-sheet optimization from financial distress. Large technology companies still have strong liquidity and credit access. The signal is the growing timing mismatch between cash spent today on compute infrastructure and revenue earned over the following years.
Four hyperscalers are already showing the capital pressure
Alphabet is the cleanest quarterly example. Its Q2 2026 SEC filing shows operating cash flow of $39.069 billion against $44.924 billion of purchases of property and equipment. On the company’s simple free-cash-flow bridge, that is -$5.855 billion after capex. The point is not distress: Alphabet still has an exceptionally strong balance sheet. The point is timing. Infrastructure investment ran faster than quarterly operating cash generation while monetization arrives over a much longer horizon.
Meta provides a second test. Its Q2 2026 10-Q reports $31.862 billion of operating cash flow, $30.116 billion of property-and-equipment purchases and $962 million of finance-lease principal payments. That leaves only about $784 million under Meta’s reported free-cash-flow measure. Using cash capex plus finance-lease principal, the quarter’s capital intensity is roughly 97.5% of operating cash flow.
Amazon pushes the pressure above one. Its Q2 2026 filing shows $45.4 billion of quarterly operating cash flow against $53.1 billion of cash capital expenditures, or about 117%. Microsoft is less compressed but still highly capital intensive: its FY2026 Q4 disclosure shows about $35.802 billion of cash additions to property and equipment against roughly $55.441 billion of operating cash flow, about 64.6%.
These ratios are not standardized accounting metrics and should not be averaged as if every company defines capex identically. They are a pressure panel. Across four of the world’s strongest cash-generating technology firms, AI infrastructure is consuming an unusually large share of internally generated cash before the full revenue stream arrives.
The hidden variable is the time gap. Compute, substations, transformers and long-duration power contracts require capital now; cloud, software and inference revenue is earned over years. The master signal is therefore not “Big Tech is running out of cash.” It is that the marginal AI project is becoming more sensitive to the price of capital before the productivity dividend is fully visible.
The $220 billion debt wave is the financing-side confirmation
Reuters reported on August 21 that AI-related U.S. corporate borrowing in 2026 had reached about $220 billion, compared with roughly $12.5 billion in 2025. That is approximately 17.6 times the prior-year amount. The same Reuters debt-market analysis put technology investment-grade spreads around 89 basis points, versus roughly 80 basis points for the broader investment-grade market.
The important interpretation is not “credit crisis.” The issuers remain among the strongest corporate borrowers in the world. The pressure comes from volume and concentration. Pension funds, insurers and asset managers have issuer and sector limits; repeated mega-deals from the same small cluster can require wider spreads or larger new-issue concessions even when credit quality remains strong.
A second layer is emerging around the semiconductor supplier itself. Reuters reported that Nvidia joined Apollo, BlackRock, Blackstone, Brookfield, Goldman Sachs and KKR in an AI-infrastructure financing effort intended to mobilize more than $500 billion of third-party capital, while Jensen Huang said Nvidia could potentially backstop as much as 25%, or roughly $125 billion, of eligible transactions. That financing architecture is not $500 billion of Nvidia debt or cash. It is evidence that the compute ecosystem is increasingly building a financing layer around demand for chips, data centers and power.
That changes the question investors should ask. “How many GPUs can be sold?” is no longer sufficient. The more useful question is: how much financial infrastructure must exist for the marginal customer to buy, house, power and monetize the next GPU cluster?
This does not mean AI issuance is the dominant driver of Treasury yields. Federal deficits, Treasury supply, inflation expectations, growth and global safe-asset demand remain larger macro forces. A Reuters Open Interest analysis makes the same caution explicit. SIAIntel’s narrower signal is crowding at the margin: hyperscaler bonds, utility debt, data-center project finance and sovereign issuance are competing for duration from overlapping investor pools.
PJM shows the same shock on the electricity side
The PJM Independent Market Monitor’s first-half 2026 report provides the physical-market mirror. Energy cost rose from $49.21/MWh to $72.68/MWh, a 47.7% increase. Capacity cost moved from $6.39/MWh to $19.61/MWh, up about 207.1%. Transmission rose from $18.82/MWh to $19.88/MWh, while total wholesale cost climbed from $76.16/MWh to $114.50/MWh, a 50.3% increase.
Monitoring Analytics estimates that including data-center load in the capacity market added $11.11/MWh to total wholesale cost, before counting additional energy and transmission effects. Across four delivery-year auctions, the monitor estimates the data-center-load effect increased capacity-market revenues by about $29.37 billion.
A second PJM metric shows how quickly the physical network is tightening. In the monitor’s detailed congestion accounting, total congestion increased from about $1.265 billion in H1 2025 to $3.540 billion in H1 2026, up 179.9%, while real-time congestion rose from about $1.872 billion to $4.539 billion. The section-level Monitoring Analytics report identifies the DOM zone and constraints around the Ashburn corridor among the important geographic signals.
A methodological distinction matters. Reuters has separately described roughly $6 billion of broader price adjustments associated with transmission constraints. That is not the same accounting metric as Monitoring Analytics’ formal $3.54 billion “total congestion” measure. PJM also disputes parts of the monitor’s line-rating and penalty methodology. A premium analysis should preserve those disagreements rather than convert unlike measures into one sensational number.
None of this proves that every increase in a PJM bill is caused by AI. Fuel prices, outages, weather, transmission topology, electrification and market rules matter. It proves something narrower and more useful: data-center demand is now large enough to be measured as a material system-cost variable in a grid that was already constrained.
The bottleneck is also transformers, switchgear and interconnection
A megawatt on a planning slide is not a delivered megawatt. The U.S. Department of Energy’s transformer-convening record describes distribution-transformer lead times that moved from a historical three to six months toward one to two years or more, while large power transformers can take roughly three to four years.
That changes the AI constraint from “find generation” to “build a complete electrical path.” A data center needs substations, high-voltage equipment, transformers, switchgear, permits and a completed interconnection. Scarcity in any one component can delay revenue even when GPUs, land and financing are available.
The economic consequence is underappreciated. Delayed energization does not only postpone a server rack; it extends the period during which capital is committed but not producing the expected revenue stream. At high real yields, time itself becomes an infrastructure cost.
For investors, this is a crucial distinction. Power scarcity can create value for generation owners, but grid-equipment scarcity can extend project schedules, raise working-capital needs and widen the gap between announced capacity and revenue-producing capacity.
Long-term PPAs are an escape valve, not a free lunch
Hyperscalers are responding by locking in power directly. Constellation’s agreement with Microsoft supports the restart of the Crane Clean Energy Center through a 20-year power purchase agreement tied to roughly 835 MW. Talen’s revised relationship with Amazon can provide up to 1,920 MW from the Susquehanna nuclear plant through 2042.
These contracts can reduce price and availability risk for the buyer and improve bankability for generators. But they do not eliminate transmission upgrades, backup requirements, balancing, interconnection queues or the cost of electrical equipment.
The financing chain is therefore becoming longer than the software narrative suggests:
AI model → accelerator → data center → substation → transmission access → firm generation → long-duration power contract → financing.
Each link can become the marginal constraint. Each has a different owner, cost of capital, regulatory regime and construction clock.
The correct conclusion is not that households automatically subsidize AI. It is that private PPAs change who bears which layer of power risk, and regulators must make those allocations explicit.
AI is now in the Fed’s inflation calculus
The most important new signal arrived on August 25. Boston Fed President Susan Collins said the AI buildout appears to be putting upward pressure on core goods inflation and warned that, absent evidence of sustained progress on inflation, tighter monetary policy could soon be appropriate. Her Boston Fed speech moves the AI buildout from a technology-sector narrative into the central bank’s live inflation framework.
Fed Governor Lisa Cook had already described the transmission channel. In her August 5 speech, Cook pointed to rapid AI-related capital spending and price pressure in semiconductors, high-tech equipment, software and utilities. The significance is not that the Fed has declared AI the cause of inflation. It has not. The significance is that AI investment demand is now visible in the same categories policymakers use to judge whether inflation is converging sustainably toward 2%.
The international evidence points in the same direction. Petra Tschudin of the Swiss National Bank said AI can push inflation higher in the short run because investment demand arrives before the full productivity dividend. The Reuters report on her August 21 remarks captures the timing problem.
This is the part the market can miss when it studies chips, power and bonds separately. AI does not need to be the dominant cause of U.S. inflation to become a Fed problem. It only needs to make the final path from above-target inflation back toward 2% more expensive or slower at the margin.
The opposite force is equally important. AI can eventually be disinflationary if automation raises productivity, reduces labor required per unit of output and lowers service costs. The SIAIntel thesis is therefore not “AI is permanently inflationary.” It is narrower and testable: the buildout phase can be inflationary before the utilization phase becomes disinflationary.
Real yields are the discount-rate amplifier, not an AI-only outcome
The 30-year U.S. TIPS real yield was around 2.95% on August 20. That matters because long-lived data centers, generation assets and transmission projects are unusually sensitive to the real discount rate.
Causality must remain disciplined. AI bond supply did not “cause” a near-3% 30-year real yield. Fiscal deficits, Treasury issuance, inflation uncertainty, term premium, growth expectations and global demand for duration are much larger forces.
AI adds a private-duration layer on top of that sovereign supply. When the risk-free real rate and credit spread are both elevated, the hurdle rate for a marginal data center rises. A project then needs higher utilization, higher AI revenue per unit of compute, cheaper hardware, cheaper power or faster energization to preserve return on invested capital.
This is why the loop is potentially self-reinforcing without being self-caused. Strong AI demand raises physical and financing requirements; those requirements can lift the project hurdle rate; the higher hurdle rate then demands faster monetization from the same AI assets.
Who pays, who benefits, and what investors should watch
Households should watch electricity-cost allocation; industrial companies should watch competition for firm power and grid equipment; investors should watch whether AI revenue growth exceeds the cost of capital and power. None of these effects is automatic or uniform across regions. Market design, PPAs, regulated tariffs and project-specific financing decide where the burden lands.
SIAIntel ACPI v0.2: measure the pressure before Wall Street names it
SIAIntel’s AI Capital Pressure Index (ACPI) is designed to turn the capital–power–policy loop into a repeatable quarterly framework without inventing false precision.
For the pilot backtest, SIAIntel proposes five components with provisional, not final, weights:
| Component | Provisional weight | What it measures | |---|---:|---| | AI-linked net bond issuance growth | 40% | How rapidly AI infrastructure is pulling on external corporate capital | | Data-center MW growth / new firm-generation MW | 25% | Whether deliverable power supply is keeping pace with concentrated load | | Regional capacity / congestion pressure | 15% | The grid-market price of scarcity | | Technology spread widening vs broad IG | 10% | Whether investors are demanding a premium to absorb technology credit supply | | 30-year real Treasury yield change | 10% | The long-duration risk-free hurdle rate under the infrastructure cycle |
Each series should be normalized on a consistent quarterly history, preferably with winsorized z-scores or percentile ranks so one extreme observation cannot dominate the index. The initial backtest should cover 2024 Q1 through 2026 Q2, then test whether the composite has explanatory power for variables such as core PCE, technology-credit spreads and subsequent hyperscaler financing intensity.
The current raw panel is already informative. Alphabet is near 115% on Q2 cash capex/OCF, Meta near 97.5% on the comparable pressure calculation including finance-lease principal, Amazon near 117%, and Microsoft near 64.6% on its Q4 cash PP&E/OCF bridge. PJM total wholesale cost is up 50.3% year on year in the first half, technology IG spreads are running above the broad IG market, and long real yields are near 3%.
But SIAIntel will not publish an official composite ACPI level until the historical series are reconstructed with consistent definitions. A synthetic 84, 90 or 100 would look precise while hiding accounting and grid-data incompatibilities. The benchmark becomes valuable only when another analyst can reproduce it quarter after quarter.
August 26 is the two-variable stress test
The next test arrives within hours. The U.S. Bureau of Economic Analysis is scheduled to release the July PCE report at 8:30 a.m. ET on August 26, according to the BEA release calendar. Later the same day, Nvidia is scheduled to report fiscal Q2 FY2027 results, with its conference call at 2:00 p.m. PT / 5:00 p.m. ET, according to Nvidia Investor Relations.
Those two releases test opposite sides of the same equation: PCE tests the discount-rate environment; Nvidia tests the earnings power supporting the infrastructure buildout.
| July PCE | Nvidia / AI demand | SIAIntel interpretation | |---|---|---| | Cooler | Strong | Goldilocks AI: demand survives while the rate burden eases. | | Hotter | Strong | Growth wins, duration loses: AI demand stays powerful but the buildout reinforces rate pressure. | | Cooler | Weak | Financing relief, demand warning: lower macro pressure cannot fully offset a weaker AI monetization signal. | | Hotter | Weak | Danger quadrant: weaker AI economics collide with a Fed that has less room to ease. |
The earnings call matters beyond revenue. Investors should listen for customer financing, Rubin deployment economics, data-center readiness, power availability, guarantees, cloud/neocloud capex and whether customers are financing capacity more aggressively to maintain the buildout.
This is where the SIAIntel signal becomes falsifiable. If PCE cools, real yields retreat, AI demand remains strong and monetization outruns financing needs, the pressure loop relaxes. If inflation stays sticky while AI infrastructure financing keeps expanding, the loop tightens.
What would break the thesis
The thesis weakens if AI revenue and utilization rise much faster than capex, allowing internally generated cash to fund the next investment wave without sustained external financing. It also weakens if inference costs collapse, semiconductor efficiency rises sharply, new generation and transmission arrive faster than data-center load, or transformer lead times normalize.
The inflation leg can fail as well. If productivity gains rapidly reduce labor and service costs, the deflationary supply effect can overwhelm power, equipment and construction pressure. In that case central banks gain room to ease even while AI capex remains high.
Broad credit conditions can also improve despite heavy AI issuance. Lower Treasury yields or a major increase in investor demand for corporate duration could absorb supply without persistent spread widening.
And the PJM leg is regional, not universal. A market with abundant generation, spare transmission and faster interconnection can experience a very different AI cost curve. ACPI must therefore separate national financing variables from regional power variables rather than pretending one grid represents the world.
Final assessment
The first phase of the AI boom was a shortage of accelerators. The second exposed a shortage of power and interconnection. The third constraint is now cheap, patient capital. The emerging fourth constraint is monetary-policy headroom.
The evidence does not say an AI crash is imminent. It says the marginal economics are changing faster than the standard “GPU demand” narrative captures.
The same investment dollar now touches four systems at once: corporate balance sheets, long-duration credit markets, regional power networks and the inflation outlook watched by central banks. That is the SIAIntel discovery.
The relevant question is no longer simply how many GPUs a company can buy. It is whether the return generated by the next rack of compute rises faster than the combined marginal cost of capital, electricity, grid access and time-to-power.
If AI productivity wins that race, today’s enormous capex wave may become tomorrow’s disinflationary expansion. If financing and energy costs keep outrunning monetization, the biggest technology investment cycle in history can become a monetary-policy problem without any single company first becoming financially distressed.
SIAIntel Signal
AI CAPITAL–INFLATION LOOP — ACTIVE. Watch the spread between AI revenue growth and the marginal cost of capital, power, grid access and time-to-power — and watch whether the Fed increasingly treats the AI buildout as a live price-input rather than a distant productivity story.
Key Takeaways
- corporate borrowing near $220 billion, while Alphabet’s Q2 filing shows $39.069bn of OCF against $44.924bn of PP&E purchases.
- Meta reports Q2 OCF of $31.862bn with $30.116bn of PP&E purchases, and Amazon reports $45.4bn of quarterly OCF against $53.1bn of cash capex.
- The buildout is consuming a historically high share of internal cash.
Data Snapshot
Coverage Area
ECONOMY
Editorial category
Read Time
~16 min
Approximate duration
Source Base
26 visible source citations
Source Map highlights 6 unique sources
Published
Aug 23, 2026
Updated: Aug 25, 2026
Source Map
6 highlighted sources
Reuters puts 2026 AI-linked U.S. corporate borrowing near $220 billion
NewswireMarket reporting / newswire context
Alphabet’s Q2 filing shows $39.069bn of OCF against $44.924bn of PP&E purchases
OfficialOfficial source context
Meta reports Q2 OCF of $31.862bn with $30.116bn of PP&E purchases
OfficialOfficial source context
Amazon reports $45.4bn of quarterly OCF against $53.1bn of cash capex
OfficialOfficial source context
Microsoft’s FY2026 Q4 disclosure confirms another large cash-capex cycle
OfficialOfficial source context
PJM’s independent monitor reports a 50.3% rise in first-half wholesale power cost
SourceReferenced source context
SIAINTEL DATA INTELLIGENCE
AI Capital Pressure Decision Console
A source-locked view of hyperscaler cash intensity, AI debt, PJM power costs and long real yields behind ACPI v0.1.
2026 AI-related U.S. debt
$220B
Reuters estimate through August 21
Highest cash capex / OCF
117%
Amazon Q2 2026 pressure reading
PJM total wholesale cost
+50.3%
First-half 2026 year-on-year increase
30-year U.S. real yield
2.95%
FRED reading on August 20
Hyperscaler capital-intensity panel
Quarterly cash capex divided by operating cash flow. Definitions are not perfectly standardized, so the chart is a pressure panel rather than a solvency ranking.
PJM wholesale-cost pressure
Monitoring Analytics first-half 2026 year-on-year cost changes. Capacity is the sharpest leg; total wholesale cost rose 50.3%.
ACPI observable pressure panel
Observed readings are separated from the inference they permit; none of these rows is an official composite ACPI score.
| Channel | Observed reading | Source boundary | Interpretation |
|---|---|---|---|
| AI financing | $220B in 2026; about 17.6× 2025 | Reuters debt-market analysis | Private-duration demand has accelerated sharply |
| Credit premium | Technology IG about 89 bp vs broad IG about 80 bp | Reuters market snapshot | AI-linked issuers face a modest spread premium |
| PJM data-center load | +$11.11/MWh wholesale-cost effect; about $29.37B across four capacity auctions | Monitoring Analytics estimate | Large-load demand is now a measurable system-cost variable |
| Grid equipment | Distribution transformers roughly 1–2+ years; large power transformers roughly 3–4 years | U.S. DOE convening record | Physical delivery can lag announced megawatts by years |
| Long-duration power | Microsoft-linked 835 MW / Amazon-linked up to 1,920 MW | Constellation and Talen disclosures | Hyperscalers are hedging availability and price risk directly |
ACPI confirmation matrix
The framework strengthens or weakens through observable capital, grid and monetization outcomes rather than a synthetic forecast path.
Scenario 1
Monetization outruns buildout
AI revenue and utilization grow faster than capex and fixed infrastructure costs.
Internal cash generation funds more of the next investment wave.
Scenario 2
Financing stays tight
AI issuance remains elevated while technology spreads and long real yields stay high.
The hurdle rate for marginal compute capacity remains restrictive.
Scenario 3
Grid bottleneck intensifies
Data-center load keeps outrunning deliverable generation, transformers and interconnection.
Power and schedule risk become a larger share of project economics.
Scenario 4
Productivity catches up
Automation and utilization gains reduce unit costs faster than buildout pressure raises them.
The inflation leg weakens even if AI capex remains high.
Source lock
Only figures visibly supported by the cited SEC filings, Reuters, Monitoring Analytics, FRED, DOE and named power agreements are plotted. No synthetic series or composite ACPI score is used.
Evidence Stack & Decision Relevance
This panel shows which decision areas the story prioritizes for citizens, companies, investors and policy makers; the full capital and risk lens should be read in the article below.
Citizens and households
Relevant for budget resilience, debt management, income security and cost-of-living exposure.
Companies, SMEs, B2B and B2C
Relevant for cash flow, pricing power, supply-chain resilience, customer risk and efficiency investment.
Investors and portfolio managers
Not an investment recommendation; a monitoring frame for risk regime, liquidity, valuation discipline and balance-sheet quality.
Regulators and policy makers
Provides signals for financial stability, capital flows, debt sustainability, investment climate and policy credibility.
The full Strategic Impact Matrix and Capital, Risk & Strategic Priority Lens appear below.
Evidence Frame
This layer summarizes visible sources, article context and editorial framing. It is analytical context, not transactional guidance.
Editorial Credit
This intelligence brief was prepared by the SIAIntel Editorial Desk.
Some contributors work in sensitive public-sector, regulatory, market, or editorial roles. Their identities may be withheld when professional duties, source protection, or safety require confidentiality.
Editorial and publishing accountability: Sefa Karahan, Founder & Publisher
Related Intelligence
Related intelligence in this category · 3 briefs

Fed May Pause. AI’s $1.5T Buildout Could Keep Rates High
US PPI went flat, but AI infrastructure commitments, bond supply and grid bottlenecks may keep long-term financing costs elevated even if the Fed pauses.
Meta’s $12.3B Bond Exposes Wall Street’s AI Debt Machine
Meta’s $12.3B data-center bond shows how Wall Street is turning Big Tech lease promises into investment-grade AI debt—and pricing a new risk premium.
Bitcoin Miners Are Selling Their Power to AI—Google and NVIDIA Are Financing the Shift
More than $70 billion in AI/HPC contracts is turning bitcoin miners into energy-backed data-centre companies financed by Big Tech.