Japan’s 10-year yield reached 3% as BOJ tightening and heavy AI debt issuance collided. The key signal is the hedge-adjusted capital shift.
Executive Signal
Japan Ministry of Finance and Reuters establish the official threshold and its immediate market trigger; together they separate the observed move from the longer-horizon capital-allocation inference.
Federal Reserve H.15 and Bank of Japan anchor the global rate benchmark and Japan-specific transmission channel; they show why nominal yield comparison alone is incomplete.
FXEmpire forward rates and Reuters define the hedge-cost and portfolio-behaviour boundary; the calculation is indicative and does not prove mass repatriation.
The confirmation chain then runs through U.S. Treasury TIC Table 5, Federal Reserve, New Security Issues, Reuters, U.S. Treasury borrowing estimate, Federal Reserve minutes, Bank for International Settlements. Read together, these sources test custody holdings, corporate issuance, AI borrowing, sovereign supply, credit conditions and FX-hedging mechanics without turning correlation into causation.
Japan’s 10-year government-bond market crossed a threshold global investors had treated as nearly impossible for three decades. On 1 September, the new JGB cleared at a 2.995% weighted-average yield, while the lowest accepted price implied 3.011%. Those are official auction results, not an estimate or a market screenshot. Japan Ministry of Finance
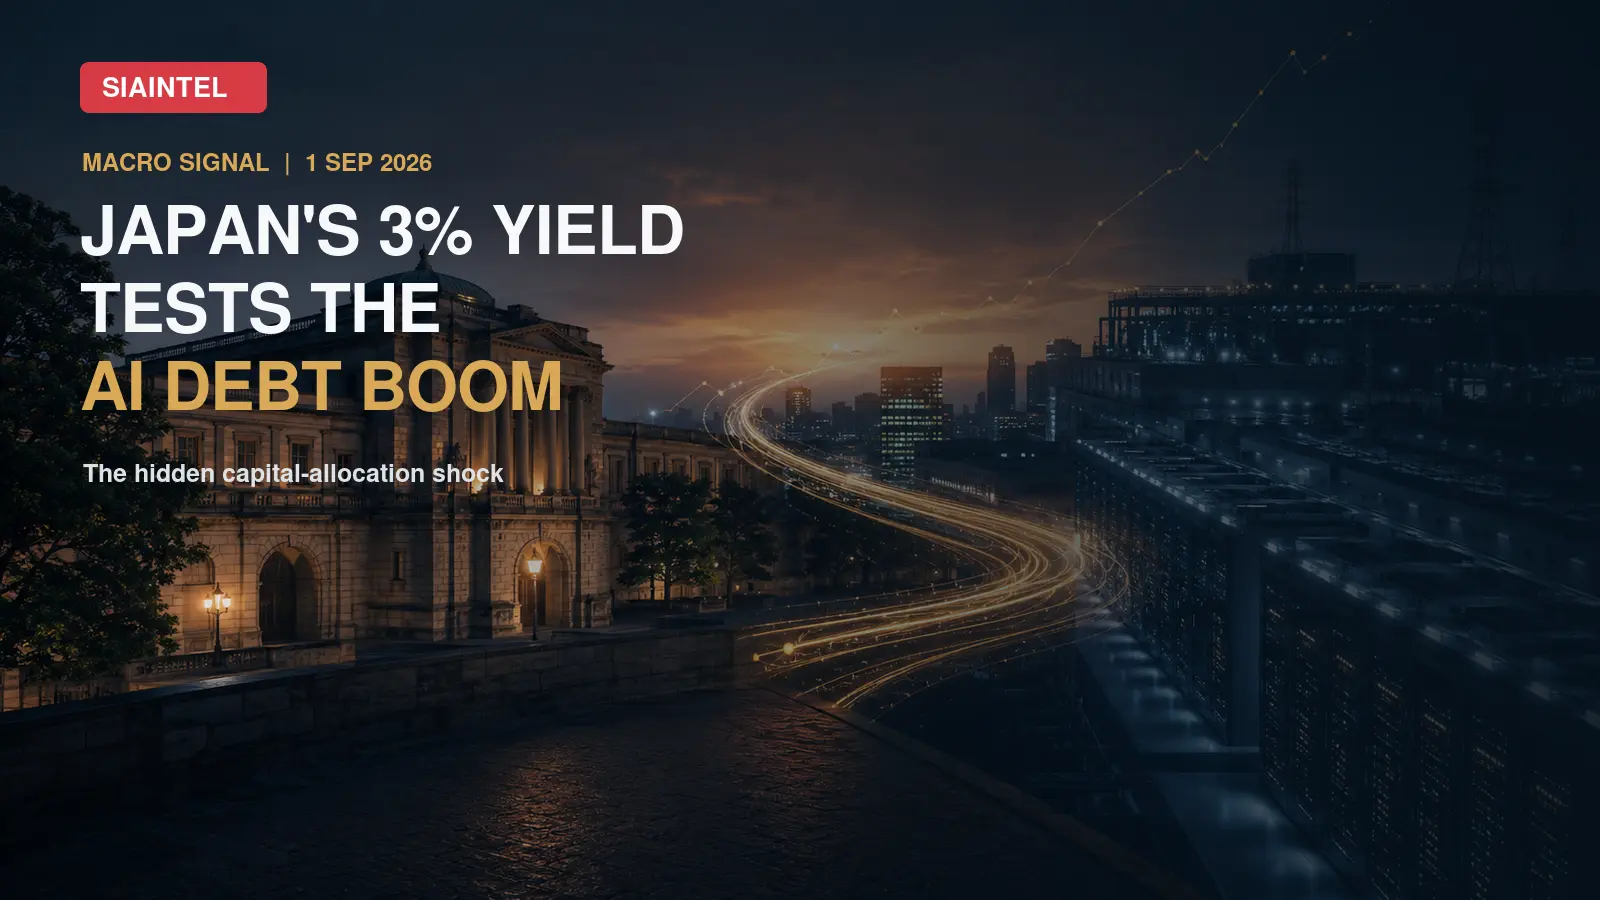
*Visual disclosure: the hero is an AI-generated editorial composite; it does not depict the 1 September auction or an actual BOJ facility.*
The number matters because Japan has long supplied savings to overseas markets. A domestic risk-free yield near 3% changes that calculation just as governments and artificial-intelligence companies are asking the same global investor base to absorb exceptional debt issuance.
> SIAIntel signal: the AI capital cycle is meeting a funding-supply shock. Japan can now pay domestic investors to stay home, potentially weakening marginal demand for foreign duration before the AI build-out reaches peak financing need.
This is not proof of mass repatriation and it is not an AI credit crisis. It is an early, testable signal about real discount rates and capital allocation.
What Changed Now
The immediate catalyst was not AI financing. It was a BOJ–yen–energy repricing. Oil rose as the Middle East conflict revived inflation risk, while the weak yen increased imported costs and pressure on the BOJ. The front end of the curve confirmed that investors were repricing policy, not only term premium.
The threshold is also fiscal. A sustained market yield above the government’s 3% budget assumption would move from symbolism into debt-service arithmetic. Yet the auction attracted robust demand and the benchmark later traded near 3.005%. That distinction matters: this was a market repricing, not a failed auction.
The BOJ has observed domestic portfolios responding. Its August review said Japanese investors were gradually increasing JGB holdings as yields rose. It also recorded a major structural shift in market supply: monthly BOJ purchases had fallen from roughly ¥5.7 trillion in July 2024 toward ¥2 trillion, and the bank decided to maintain purchases around that level from April 2027 rather than continue reducing them. Purchases remain below redemptions and below 20% of monthly issuance, leaving more duration with private investors. Bank of Japan
The Missing Variable: the Hedged Return
At the 1 September market snapshot, USD/JPY was 159.977, the three-month forward mid-rate was 158.844 and the six-month forward was 157.702. For a yen investor buying dollars spot and locking in the sale forward, both tenors implied a simple annualised hedge drag of roughly 2.8%. FXEmpire forward rates
| Indicative carry comparison | Reading |
|---|---|
| USD/JPY spot | 159.977 |
| Three-month forward | 158.844 |
| Simple annualised hedge drag | 2.83% |
| U.S. 10-year Treasury yield | 4.798% |
| Stylised yen-hedged Treasury yield | 1.97% |
| Japan 10-year government-bond yield | approximately 3.00% |
| Indicative JGB advantage | approximately 1.03 percentage points |
The disclosed arithmetic is:
> Annualised hedge drag ≈ ((159.977 − 158.844) / 159.977) × 4 = 2.83%. > Stylised hedged Treasury yield ≈ 4.798% − 2.83% = 1.97%.
This is an indicative carry comparison, not a realised-return forecast. It applies a rolling short-dated hedge to a long-duration bond and excludes basis variation, transaction costs, hedge ratio, accounting treatment and bond-price changes. Even with those caveats, the direction is important: on this snapshot, the JGB offered roughly 100 basis points more than the stylised yen-hedged Treasury.
Reuters had already reported in July that JGB yields were comparable with or better than Treasuries on an FX-hedged basis. It also identified the missing confirmation: Japanese investors had shown little appetite to reduce overseas holdings on a large scale. Reuters
The causal claim must therefore be narrow. A 3% JGB did not suddenly create the incentive to repatriate; expensive dollar hedging had already weakened the case for adding U.S. duration. The 3% threshold reinforces an existing home-bias incentive and makes it more visible.
Is Japanese Capital Already Returning Home?
U.S. Treasury custody data offer an early but imperfect clue. Japan’s estimated Treasury holdings fell from $1.2393 trillion in February to $1.1167 trillion in June 2026—a decline of $122.6 billion, or about 9.9%. U.S. Treasury TIC Table 5
That decline cannot be labelled proven repatriation. Custody location, valuation changes and third-country accounts prevent precise attribution of the beneficial owner. The data identify a direction worth monitoring, not a causal verdict.
There is also an unhedged branch. Japanese investors can avoid forward costs by keeping dollar exposure, but a BOJ rate increase, intervention or stronger yen can erase the extra Treasury coupon through currency losses. The choice is therefore between unattractive hedged carry and material unhedged FX risk—not between two clean nominal yields.
The Other Side: Record Capital Demand
Japan’s potential inward rotation would be manageable in an ordinary issuance cycle. This is not an ordinary cycle. Federal Reserve data show U.S. corporations raised $1.892 trillion through bonds in the first seven months of 2026. Nonfinancial issuance reached $914.8 billion, about 89% of the full-year 2025 total. Federal Reserve, New Security Issues
AI is a material part of the wave. Reuters, citing LSEG, reported that Alphabet, Amazon and Meta had issued almost $220 billion of bonds in 2026 by mid-August—more than double their combined 2025 volume. Reuters
Sovereigns are competing for the same duration. The U.S. Treasury expects $739 billion of privately held net marketable borrowing in the July–September quarter and $628 billion in October–December. U.S. Treasury borrowing estimate
Credit markets have not confirmed a crisis. The July Federal Reserve minutes described corporate spreads as very low by historical standards, credit availability as generally strong and defaults as near the lower part of their historical distribution. Federal Reserve minutes
The verified signal is therefore a risk-free-rate and capital-allocation shock, not an AI credit event. The largest issuers can still borrow. Pressure should appear first in weaker borrowers, leveraged data-centre vehicles and projects without contracted power or credible utilisation.
30-Second Signal
Reuters reported that the benchmark JGB yield touched 3% for the first time since 1996 as the U.S.–Iran conflict lifted oil and inflation fears, the yen remained weak and investors moved toward faster BOJ tightening. The same report said the two-year yield reached 1.81%, the five-year hit 2.265%, and the government had already used a 3% long-term rate assumption in fiscal-2026 debt-service calculations. Reuters
The global backdrop was already restrictive. The Federal Reserve’s H.15 release put the 10-year Treasury at 4.73%, the 30-year at 5.22% and the 10-year inflation-protected yield at 2.42% on 28 August. High real rates, not only inflation expectations, were already doing the tightening. Federal Reserve H.15
The deeper question is not whether the nominal Treasury yield is above the JGB yield. It is whether Japanese investors still earn more after hedging dollars back into yen.
Scenario Matrix
Controlled repricing — 50%. JGB yields stay near 3%, portfolios rotate gradually and global yields remain high but orderly. Investment-grade AI borrowers retain access while marginal projects face higher hurdle rates.
Capital collision — 30%. JGB yields move decisively above 3%, Japanese demand for foreign duration weakens, U.S. real yields rise and AI-linked spreads begin widening. Stress appears first in leveraged project vehicles and power-constrained developments.
Energy relief — 20%. Oil retreats, inflation pressure eases and BOJ tightening expectations fall. Global long yields decline even if JGBs remain structurally more attractive than in the pre-2022 regime.
The weights are SIAIntel editorial scenarios, not statistical probabilities.
Final Assessment
The headline is that Japan’s 10-year yield reached 3% for the first time since 1996. The immediate cause was a BOJ–yen–energy repricing, not the AI debt boom.
The deeper signal is that one of the world’s largest savings pools can now earn a meaningful return at home—and, on an indicative hedge-adjusted basis, more than it can earn in Treasuries—while governments and the AI industry are asking investors to finance more duration.
That does not prove a bond crisis. It changes who must pay to prevent one.
> The cheap-capital era does not end when borrowing stops. It ends when the marginal lender finally has somewhere else to go.
SIAIntel Final Signal
Japan’s 3% yield is an early warning about the price of marginal capital, not a declaration that an AI credit crisis has begun.
Source Map
6 highlighted sources
SIAINTEL CAPITAL ALLOCATION
Japan 3% Funding Collision Console
Hedge-adjusted sovereign returns, global issuance pressure and the evidence needed to confirm Japanese capital reallocation.
JGB auction yield
2.995%
Official weighted-average result
Hedged UST carry
1.97%
Stylised 10Y yield after 3M hedge drag
JGB advantage
+1.03 pp
Indicative gap versus hedged Treasury
Three-firm AI debt
~$220B
Alphabet, Amazon and Meta by mid-August
The nominal Treasury advantage disappears after hedge cost
Indicative carry comparison using the September 1 spot and three-month forward snapshot.
The capital race is already advanced
2026 issuance through July for U.S. corporates and nonfinancials; AI figure through mid-August.
Confirmation dashboard
The thesis becomes stronger only when price, flow and credit evidence move together.
| Signal | Current reading | Confirm | Disconfirm |
|---|---|---|---|
| JGB regime | 2.995% average; 3.011% tail | Repeated auctions near/above 3% | Yield falls with energy relief |
| Hedged spread | JGB about +1.03 pp | Gap persists at 3M and 6M | Forward cost falls sharply |
| Japanese UST holdings | $1.1167T in June | Another fall plus domestic JGB buying | Holdings stabilise or rebound |
| Corporate credit | Broad spreads still tight | AI-linked spreads widen | Heavy issuance absorbed cleanly |
SIAIntel scenario map
Editorial weights, not statistical probabilities.
Scenario 1
Controlled repricing — 50%
JGB stays near 3%; rotation remains gradual.
AI investment grade keeps access; marginal projects pay more.
Scenario 2
Capital collision — 30%
JGB rises, foreign-duration demand weakens and real yields climb.
Stress begins in leveraged and power-constrained projects.
Scenario 3
Energy relief — 20%
Oil and inflation pressure ease; BOJ expectations cool.
Global long yields retreat and the funding shock softens.
Evidence boundary
Observed figures are source locked. The 1.97% hedged Treasury is an indicative carry calculation, not a realised-return forecast; repatriation is not confirmed and scenario weights are editorial.
Editorial Credit
This intelligence brief was prepared by the SIAIntel Editorial Desk.
Some contributors work in sensitive public-sector, regulatory, market, or editorial roles. Their identities may be withheld when professional duties, source protection, or safety require confidentiality.
Editorial and publishing accountability: Sefa Karahan, Founder & Publisher
Related Intelligence
Related intelligence in this category · 3 briefs
AI Has Entered the Fed’s Reaction Function
AI’s investment boom may lift the neutral rate and bond yields before productivity lowers inflation. The Fed now faces a timing problem.

Fed May Pause. AI’s $1.5T Buildout Could Keep Rates High
US PPI went flat, but AI infrastructure commitments, bond supply and grid bottlenecks may keep long-term financing costs elevated even if the Fed pauses.

Can Falling US Unemployment Trigger a Fed Hike?
US payrolls fell by 23,000 while the labor force shrank by 264,000 and unemployment dropped to 4.1%. July CPI is now the Fed’s next critical policy trigger.