"Exxon and Chevron earned $26.6B as refining scarcity, Hormuz transit and war-risk insurance reshaped the inflation and Fed outlook."
SIAINTEL INTELLIGENCE DOSSIER
Analysis Brief
SIAIntel Verification Panel
Analysis, data context, source mapping and editorial boundaries are presented as one evidence chain.
Key Takeaways
- ExxonMobil and Chevron generated roughly $26.6 billion of second-quarter profit.
- That turns Exxon earnings 2026 and Chevron earnings 2026 into a macro signal.
- Refining margins, war-risk insurance and product inventories can transmit the Hormuz oil shock into transport costs, oil inflation, Treasury yields and the timing of Federal Reserve rate…
SIAIntel Perspective
SIAIntel frames this development not as a standalone headline, but as an intelligence brief shaped by source quality, structural implications and observable risk channels.
Data Snapshot
Coverage Area
Editorial category
ECONOMY
Read Time
Approximate duration
~10 min
Source Base
Visible evidence profile
Article context
Published
Updated: Aug 01, 2026
Jul 31, 2026
Evidence Frame
This layer summarizes visible sources, article context and editorial framing. It is analytical context, not transactional guidance.
ExxonMobil and Chevron generated roughly $26.6 billion of second-quarter profit. Reuters’ Exxon earnings analysis and Reuters’ Chevron earnings analysis show why the headline matters, but the deeper signal is not simply a higher crude price: the scarce barrel is the one that can be shipped through the Strait of Hormuz, insured, refined and sold as diesel, jet fuel or gasoline.
That turns Exxon earnings 2026 and Chevron earnings 2026 into a macro signal. Refining margins, war-risk insurance and product inventories can transmit the Hormuz oil shock into transport costs, oil inflation, Treasury yields and the timing of Federal Reserve rate cuts.
SIAIntel signal: The new scarcity unit is not a barrel in the ground. It is a barrel that can cross a contested corridor, obtain insurance, reach an operating refinery and emerge as a high-value transport fuel.
The four numbers behind Big Oil’s $26.6 billion signal
- $14.5B: Exxon’s GAAP profit, its highest quarterly result in four years—not an all-time record.
- $12.1B: Chevron’s GAAP profit, its strongest quarter in six years.
- 97%+: Chevron’s U.S. crude-unit utilisation, alongside record domestic refinery throughput.
- 23%: the approximate July rise Brent was heading for as Hormuz risk remained active.
Non-additivity boundary: $26.6 billion is the sum of two reported GAAP earnings figures. It is not an estimate of consumer losses, an inflation forecast or a measure of the total Hormuz shock.
Exxon earnings and Chevron earnings reveal two profit engines
ExxonMobil’s official 2Q26 materials show $14.5 billion of GAAP earnings and $14.7 billion of adjusted earnings. Permian output exceeded 1.8 million barrels of oil equivalent per day, while stronger refining economics and diesel production supported the products business. Qatar-related volume losses and volatile commodity and product margins limited the upside versus consensus.
Chevron’s official 2Q26 results show $12.1 billion of GAAP earnings, upstream profit of about $8.2 billion and downstream profit of about $4.9 billion. U.S. production reached roughly 2.08 million boe/d, refinery throughput set a record and crude-unit utilisation exceeded 97 percent.
| Metric | ExxonMobil | Chevron | Signal |
|---|---|---|---|
| GAAP earnings | $14.5B | $12.1B | Combined $26.6B |
| Upstream evidence | Permian above 1.8M boe/d | Upstream about $8.2B | Production premium |
| Downstream evidence | Products rebound; record diesel output | Downstream about $4.9B; 97%+ utilisation | Conversion premium |
Why Exxon missed while Chevron beat
The divergence should not be reduced to geography. Chevron had less direct exposure to disrupted Middle East production, but its decisive surprise came from downstream performance that exceeded analyst assumptions. Exxon also benefited from high oil prices and refining margins, yet Qatar-related outages, maintenance timing and extreme margin volatility made the quarter harder to model.
The investable lesson is that high crude prices can lift the sector, while the size of the earnings surprise depends on geographic resilience, refinery availability, maintenance timing and logistics access. Integrated oil companies can capture value at production, refining and distribution points that pure producers cannot.
The Strait of Hormuz is no longer simply open or closed
Reuters’ July 31 Hormuz report said Iran claimed two ships were stopped and four tankers turned back, while tracking data showed selected large vessels still passed. The specific Iranian claims were not independently verified, so the correct frame is a permission-based and fragmented corridor—not a fully closed waterway.
Some cargoes may pass through negotiated channels while others face delay, diversion or denial. The route therefore carries costs that do not appear in the Brent screen alone: transit permission, war-risk insurance, tanker availability and the distance of alternative routes.
The same report described military risk spreading beyond the strait and Brent heading for an approximately 23 percent July gain. That makes the physical operating regime more important than a binary “open/closed” headline.
- Transit permission: regular commercial access matters more than isolated tanker passages.
- War-risk insurance: premiums can stay elevated even when crude prices pause.
- Freight capacity: tanker scarcity can widen delivered-fuel costs.
- Route duration: detours tie up vessels and delay inventories.
EIA’s oil forecast is now a conditional counter-thesis
EIA’s July 2026 Short-Term Energy Outlook assumed that the June 18 U.S.–Iran memorandum would support more Hormuz traffic and a recovery in oil flows. Under that scenario, Brent averaged $74 per barrel in 3Q26 and $65 in 2027; U.S. gasoline fell from $4.21 per gallon in 2Q26 to $3.80 in 3Q26 and about $3.40 in 4Q26.
The detailed EIA STEO data tables remain useful as a measurable normalisation case, but the forecast was completed before later July attacks, permit-based transit and insurance stress intensified.
| EIA variable | 2Q26 / current reference | Normalisation path | Condition |
|---|---|---|---|
| Brent | Conflict premium active | $74 in 3Q26; $65 in 2027 | Shipping and production recover |
| U.S. gasoline | $4.21/gal in 2Q26 | $3.80 in 3Q26; ~$3.40 in 4Q26 | Inventories rebuild |
| Refining margins | Elevated | Narrow after summer | Product supply catches up |
This does not prove the EIA wrong. It means the forecast should be read as a conditional counter-thesis requiring regular transit, falling insurance costs, inventory rebuilding and narrower crack spreads.
Refining margins may matter more than the crude price
EIA’s petroleum-products review shows U.S. gasoline inventories below their five-year range in April and May as refiners prioritised jet fuel and maintained distillate output. Refinery capacity and product mix cannot adjust as quickly as upstream production.
That allows Brent to fall while the diesel crack spread, jet-fuel margins or gasoline margins remain high. Exxon and Chevron’s downstream profits are balance-sheet evidence that the conversion spread widened sharply.
| Indicator | Bullish scarcity reading | Normalisation reading |
|---|---|---|
| Diesel crack spread | Stays high while Brent falls | Narrows with inventory growth |
| Jet-fuel margin | Demand and refinery mix stay tight | Capacity and stocks recover |
| War-risk insurance | Remains elevated | Premiums normalise |
| Refinery utilisation | High but constrained by maintenance | Stable with wider spare capacity |
| Product inventories | Below normal range | Sustained rebuilding |
Oil inflation can return through the second round
BLS June CPI data showed headline CPI down 0.4 percent month over month, energy down 5.7 percent and gasoline down 9.7 percent. Core CPI was unchanged. On the surface, that was a disinflationary month.
But BLS annual-price analysis showed energy still 15.7 percent higher year over year and gasoline 26.7 percent higher. The sequence—large rises in March, April and May followed by a sharp June reversal—signals volatility rather than a settled trend.
- diesel into road freight and food distribution;
- jet fuel into airfares and tourism margins;
- marine freight into imported goods;
- petrochemical feedstocks into packaging and industrial inputs;
- persistent energy costs into company pricing decisions.
Pass-through is not automatic or one-for-one. The risk rises when finished-fuel margins, freight and insurance remain high long enough to affect contracts and service prices.
The Fed risk is delayed rate cuts, not an automatic hike
The Federal Reserve’s June 2026 projections placed 2026 PCE inflation at 3.6 percent, core PCE at 3.3 percent and the median appropriate year-end federal-funds rate at 3.8 percent. Seventeen of 18 participants judged inflation risks to be weighted to the upside.
A renewed energy shock would not automatically trigger a rate increase. The more plausible channel is timing: if oil inflation moves into logistics, services and expectations, Fed rate cuts can be delayed and the long end of the Treasury curve can retain a higher inflation and term premium.
SIAIntel inference: Big Oil’s current profit may be pricing not the next rate increase, but the risk of a later rate cut.
Capital discipline protects investors but slows supply relief
Reuters Breakingviews’ capital-allocation analysis reported that Exxon returned more than $9 billion to shareholders and reduced net debt by about $7 billion, while Chevron returned about $6.5 billion and reduced debt by a record $8.4 billion.
Neither company launched an aggressive new capital-expenditure race. Management discipline reduces the chance of another overinvestment cycle, but it also means exceptional refining margins do not quickly create new refineries, tankers or secure shipping corridors.
| Company | Shareholder returns | Debt action | Strategic reading |
|---|---|---|---|
| ExxonMobil | > $9B | Net debt down ~ $7B | Cash discipline; no rapid capacity response |
| Chevron | ~ $6.5B | Debt down record $8.4B | Balance-sheet repair before expansion |
For investors, this supports free cash flow and return on capital. For consumers and energy-intensive companies, it offers no guarantee of quick physical relief.
Premium counter-thesis: $26.6 billion could mark the peak
If Hormuz transit becomes regular, attacks subside and war-risk insurance normalises, delayed exports can return to market. If U.S. gasoline and distillate inventories rebuild after the summer, product margins can compress quickly.
June CPI also showed that energy prices can reverse sharply, while core inflation did not yet display a persistent second-round loop. The EIA’s $74 Brent and lower gasoline path provide a quantified downside case.
Counter-thesis: If shipping normalises, inventories rise and product spreads narrow, 2Q26 may be an exceptional but difficult-to-repeat earnings peak for Exxon and Chevron.
Audience Impact
Investors
Integrated oil companies can monetise both upstream prices and refining margins, but straight-line extrapolation of a geopolitically boosted quarter is dangerous.
Companies
Airlines, logistics, chemicals, heavy industry and retailers should monitor finished-fuel prices, freight and insurance—not Brent alone.
Credit markets
Producer balance sheets are strengthening while low-margin energy consumers may face weaker interest coverage and wider credit spreads.
Policymakers
Strategic reserves can cushion crude supply, but they cannot directly create refinery capacity, tanker availability, insurance cover or secure passage.
Catalyst dashboard: what confirms or breaks the thesis
- Hormuz transit count: regular, non-negotiated commercial flows.
- War-risk insurance: falling premiums across Gulf and Red Sea routes.
- Diesel and jet-fuel crack spreads: persistence versus Brent.
- U.S. gasoline and distillate inventories: sustained rebuilding.
- July and August CPI: evidence of energy pass-through into core categories.
- Exxon and Chevron capital plans: a shift from buybacks and debt reduction toward capacity.
No single catalyst is decisive. The strongest confirmation would be a cluster: fragmented transit, elevated insurance, high product spreads and delayed Fed easing.
Bottom line: the scarce asset is the usable barrel
Exxon and Chevron’s $26.6 billion quarter is not merely evidence that oil companies profit during conflict. It shows where the energy system currently assigns scarcity value.
Value is migrating from reserves alone toward the infrastructure that transports, insures, refines and distributes the barrel. That is why a refinery margin can matter more for inflation than the headline crude price.
If physical normalisation arrives, the quarter may stand as the top of the cycle. If transit remains permission-based and fragmented, Big Oil’s earnings become an early balance-sheet warning for oil inflation, Treasury yields, corporate margins and the timing of Fed rate cuts.
Frequently asked questions
Why did Exxon and Chevron earn so much?
Higher upstream prices, resilient production and unusually strong refining margins combined. Chevron also benefited from a stronger-than-expected downstream quarter.
Is the Strait of Hormuz closed?
Not fully. The evidence supports a fragmented, permission-based regime in which selected vessels pass while others face delay, diversion or denial.
Does this guarantee higher inflation?
No. Pass-through depends on duration, product margins, freight, inventories and corporate pricing. The risk is conditional, not automatic.
What would invalidate the SIAIntel thesis?
Regular transit, lower insurance costs, rebuilding fuel inventories, narrower crack spreads and continued disinflation would support the counter-thesis.
Image provenance
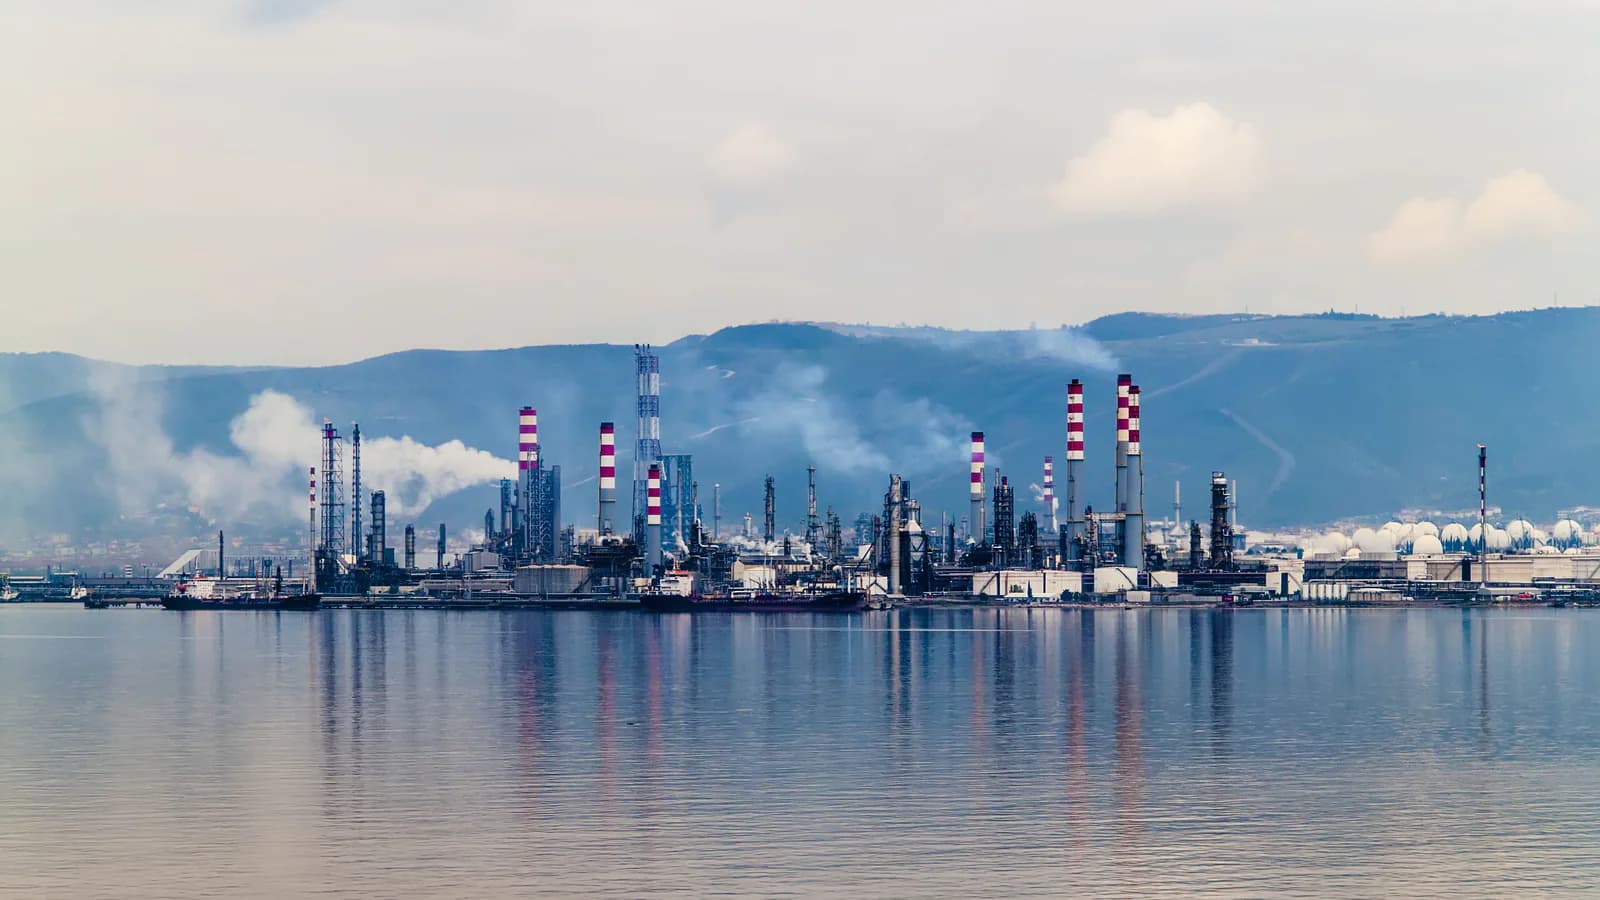
The cover is a real CC0 photograph of an oil and natural-gas refinery in Turkey. It is representative and does not depict an ExxonMobil or Chevron facility, the Strait of Hormuz or the 2026 events. The image is cropped, resized and converted to WebP without generative alteration.
Editorial Credit
This intelligence brief was prepared by the SIAIntel Editorial Desk.
Some contributors work in sensitive public-sector, regulatory, market, or editorial roles. Their identities may be withheld when professional duties, source protection, or safety require confidentiality.
Editorial and publishing accountability: Sefa Karahan, Founder & Publisher
Related Intelligence
Related intelligence in this category · 6 briefs

The $310B Stablecoin Deadline Passed. No Rules Arrived.
The July 18 GENIUS Act deadline passed without a coordinated final rulebook, leaving a $310 billion stablecoin market in a legally unfinished transition.

AI's Credit Grid Squeeze: How Data Centers Turned Power Access Into a Bond Market Problem
Data center power demand is colliding with grid capacity, utility capex, and bond markets. Here is how AI's electricity problem became a credit-market problem.
Japan’s Stablecoin Push Turns Sovereign Bonds Into the Next Crypto Battleground
Analysis of MUFG, SMBC, and Mizuho's 2027 stablecoin plans. Analyzing how digital yen reserves and on-chain repo could reshape JGB demand and Asian settlement rails.
Japan’s Trillion-Yen Capital Rotation Sends a Warning Through Global Markets
Japanese investors sold foreign equities and bought foreign bonds in May, sending a warning through U.S. Treasuries, tech stocks, the yen and global risk appetite.
The 60/40 Breakdown: The Hidden Crack in Global Bond Markets
Treasuries are losing part of their hedge role as G7 debt stress, inflation risk and stock-bond correlation reshape global portfolio strategy.
A 30-Year High and a $1.9 Trillion Deficit: How Japan's Bond Signal Is Feeding America's Fiscal Pressure
Japan's 30-year high bond yield and America's $1.9 trillion deficit projection are sending a global warning signal, from mortgages and pensions to emerging-market debt.