"Data center power demand is colliding with grid capacity, utility capex, and bond markets. Here is how AI's electricity problem became a credit-market problem."

SIAINTEL INTELLIGENCE DOSSIER
Analysis Brief
SIAIntel Verification Panel
Analysis, data context, source mapping and editorial boundaries are presented as one evidence chain.
Key Takeaways
- AI's Credit Grid Squeeze: How Data Centers Turned Power Access Into a Bond Market Problem Executive Signal AI's bottleneck is no longer just chips or talent.
- It is increasingly the physical grid and the debt markets that finance it.
- Global electricity demand tied to data centers and AI workloads is on a structurally rising path.
SIAIntel Perspective
SIAIntel frames this development not as a standalone headline, but as an intelligence brief shaped by source quality, structural implications and observable risk channels.
Data Snapshot
Coverage Area
Editorial category
ECONOMY
Read Time
Approximate duration
~13 min
Source Base
Visible evidence profile
Article context
Published
Updated: Jul 02, 2026
Jul 02, 2026
Evidence Frame
This layer summarizes visible sources, article context and editorial framing. It is analytical context, not transactional guidance.
Executive Signal
AI's bottleneck is no longer just chips or talent. It is increasingly the physical grid and the debt markets that finance it. Global electricity demand tied to data centers and AI workloads is on a structurally rising path. The IEA Energy and AI executive summary reports global data centre electricity consumption reached approximately 415 TWh in 2024 and is set to more than double to roughly 945 TWh by 2030. In the U.S., the DOE / LBNL 2024 Report on U.S. Data Center Energy Use notes electricity use surged from 58 TWh in 2014 to 176 TWh in 2023, and could reach 325-580 TWh by 2028. Goldman Sachs Research projects U.S. data center power demand could rise from 31 GW in 2025 to 66 GW by 2027, with the peak summer demand share potentially rising from 4.1% to 8.5% in that period. Goldman measures peak power capacity, while the DOE / LBNL report measures annual energy consumption; read together, they point to the same direction of travel rather than the same unit of measurement. That demand has to be financed, and the financing is now visible in regulatory dockets, capacity auctions, and corporate bond prospectuses at the same time.
What Changed
Three things moved in the same direction within a matter of weeks. Federal regulators tightened the rules on how large electricity loads connect to the grid. The largest U.S. grid operator went through a contested stakeholder process over how to allocate the cost and risk of new data center demand. And hyperscalers kept issuing debt at a pace large enough that bankers are now structuring multi-currency deals to avoid saturating any single bond market.
The Mechanism
The chain runs in one direction: data centers need power, power needs grid interconnection capacity, interconnection capacity needs utility and grid-operator capital expenditure, and that capex increasingly gets financed through debt markets rather than paid for entirely out of current rates. At the same time, the hyperscalers building the data centers are themselves issuing record volumes of corporate debt to fund chips and buildouts. Two separate debt channels - utility-side capex and hyperscaler-side capex - are converging on the same underlying driver, which means credit markets are now pricing AI infrastructure risk from both directions at once.
Power Grid Lens
FERC ordered all six regional grid operators under its jurisdiction to justify or reform tariffs for data centers and other large energy users. The Section 206 show-cause orders, issued June 18, 2026, target PJM, MISO, SPP, CAISO, ISO-NE, and NYISO, and apply to loads exceeding 50 MW connecting above 69 kV. These orders have introduced a requirement for a 30-day generation adequacy informational report alongside the standard 60-day response window. Beyond cost allocation, the orders highlight specific reform buckets: alternative transmission technologies, cost transparency, co-location, interim/non-firm transmission service, flexible loads, and resource-adequacy reporting. The legal significance is not only timing; as White & Case's FERC summary frames it, large-load interconnection is becoming a tariff-design problem, not just an engineering queue problem.
PJM, the largest U.S. grid operator, has been working through its own version of this problem since late 2025. In the PJM footprint, the debate has evolved beyond deadlock into the PJM Reliability Backstop Procurement - a concrete short-term capacity mechanism designed to address reliability gaps while long-term reforms are finalized. The unresolved question remains the same: who pays when a data center wants to connect faster than new generation and transmission can be built, and who bears the cost if that data center's projected load never fully materializes.
ERCOT Stress Lens
The grid stress is not unique to PJM. In Texas, ERCOT faces a 438 GW large-load request queue, with data centers accounting for nearly 90% of that volume, according to Utility Dive's ERCOT large-load queue report. This demonstrates that regardless of market design - whether the centralized capacity model of PJM or the energy-only construct of Texas - the physical pressure of AI load remains a structural constant.
Credit Market Lens
Capacity prices are one visible signal of the cost being allocated. PJM's 2026/2027 Base Residual Auction cleared at $329.17 per MW-day across most of its footprint - the FERC-approved price cap - up from $269.92 the prior year, with the BGE and Dominion zones clearing even higher. That cost flows into utility revenue requirements and, ultimately, into the credit profile utilities present to bond investors when they raise capex financing.
On the hyperscaler side, AI-linked corporate borrowing is large enough to change deal structuring. Bankers are turning to multi-currency issuance specifically to avoid overloading the dollar bond market with hyperscaler paper. While data center-specific bonds remain a developing structure, they are developing, not hypothetical. Morgan Stanley's AI-debt framing highlights a broader credit-market point: AI-related global debt issuance is no longer marginal, and a data-center-specific high-yield deal is best read as one visible node inside a much larger financing wave. This indicates that while the asset class is maturing, it has not yet reached mainstream saturation.
## Equipment Supply Chain Lens Grid capex, debt markets and transformer manufacturing lead times are now moving in opposite directions. Money is abundant; high-voltage transformers are not. Wood Mackenzie's transformer lead-time work places large transformer delivery windows in an 80-210 week range, while its U.S. transformer supply analysis says power transformer unit costs have risen 77% since 2019. That turns the AI buildout into a two-clock problem: bond markets can fund a project in days, but transformers, switchgear, interconnection studies and energized substations move on multi-year timelines.
Ratings & Funding Lens The credit signal is now visible in rating-agency language. S&P Global Ratings' 2026 industry credit outlook points to utility cash-flow deficits of about $100B and warns that materially rising rate-case revenue requirements need consistently fair regulatory outcomes to preserve credit quality. The investor translation is simple: a utility can be right about demand and still wrong-footed on timing if customer bills, regulators and capital markets do not absorb the capex cycle at the same speed.
Connect-and-Manage Credit Lens PJM's proposed choice set has a hidden financial cost. Under a bring-your-own-generation pathway, large loads may need firm new power behind the project. Under Connect and Manage, White & Case's PJM analysis says large loads that do not bring sufficient generation operate under curtailment protocols and may need on-site diesel or gas backup to prevent service disruption. Reuters' January report on PJM's plan described the same fork: bring power or accept earlier curtailment. For an AI data center, curtailment is not just an operating inconvenience; it is a revenue, uptime and debt-service variable. A recent connect-and-manage grid-integration paper formalizes the same tension by treating curtailment as an explicit planning variable for gigawatt-scale AI loads.
Macro Lens: Inflation and Ratepayer Exposure
The convergence of capacity-market spikes and utility capex pass-through creates a tailwind for sticky electricity inflation. As utilities pass these grid-modernization costs to ratepayers, it complicates long-duration borrowing-cost dynamics and increases ratepayer exposure to infrastructure cycles. While this contributes to broader inflationary pressure, it is treated as a sector-specific risk rather than a direct driver of Federal Reserve policy.
Treasury Demand Lens
A separate question is whether foreign buyers - particularly Japan, the largest foreign holder of U.S. Treasuries - are pulling back from Treasury demand in a way that would tighten the financing backdrop further. The data does not support that. Japan held about $1.2099 trillion in U.S. Treasuries in April 2026, up from about $1.1916 trillion in March, per official U.S. Treasury TIC Table 5 data. This is an increase, not a drawdown. The nuance is that April still sat below Japan's February 2026 level of about $1.2393 trillion, while the April TIC release showed a net TIC inflow of $26.1B, split between $49.2B of official inflows and $23.1B of private outflows.
Japan Duration Buyer Lens
Japan's position as the largest foreign holder of Treasuries makes its demand behavior a structural input into U.S. long-duration borrowing costs, which in turn affects the cost of capital available to utilities and grid operators financing AI-era buildouts. The April 2026 increase in Japanese holdings suggests continued appetite for U.S. duration rather than a rotation away from it, at least as of the most recent reported month. Future marginal demand from Japan depends more on JGB yields and Bank of Japan policy than on any domestic payments-technology initiative.
Crypto / Stablecoin Collateral Lens
Japan is also building bank-led digital settlement rails, but there is no verified link between those rails and U.S. Treasury selling. Stablecoins, in Japan or elsewhere, are not a verified mechanism for absorbing AI-linked corporate debt supply. While stablecoin reserve demand can support short-dated Treasury collateral, that is distinct from the direct absorption of AI-linked utility or hyperscaler credit risk.
Country Lens
- United States: strongest capital markets, but grid bottlenecks and ratepayer politics.
- Japan: Treasury anchor; future marginal demand depends on JGB yields and BOJ policy.
- Europe: stricter planning may reduce chaos, but power scarcity and slow permitting remain constraints.
- Gulf: energy and capital advantage, but cooling/water/geopolitical risk.
- India / Southeast Asia: demand and digital scale, but grid reliability and permitting decide winners.
- Turkiye: SIAIntel inference only - bridge potential if power availability, grid upgrades, fiber routes, data sovereignty, and financing discipline align.
Company Lens
Hyperscalers including Amazon and Alphabet are named in current reporting as issuing AI-linked debt across multiple currencies to manage market absorption capacity. PJM, as a grid operator rather than a corporate issuer, is the operational chokepoint translating data center demand into the capacity prices and interconnection rules that ultimately shape utility credit profiles.
Before announcing an AI or data center project, companies need to secure five things:
- firm power
- an interconnection timeline
- clarity on who pays for grid upgrades
- curtailment exposure
- debt financing terms
People / Consumers Lens
The mechanism described here has a direct line to electricity bills. PJM-region ratepayers face billions of dollars in added capacity-market costs tied to data center-driven demand growth. Badly handled cost socialization raises bills for everyone, regardless of who actually drove the new demand. Well-designed policy can instead turn AI load into grid modernization, construction jobs, and a larger local tax base. The unresolved policy question across the FERC and PJM processes comes down to one question: who pays for AI's grid?
Strategic Impact Matrix
| Layer | What is moving | Primary signal | Who is exposed |
|---|---|---|---|
| Power grid | FERC show-cause orders, PJM tariff reform process | 30-day informational report; reform buckets (GETs, non-firm service) | Grid operators, utilities, large-load customers |
| Capacity markets | PJM auction clearing at FERC price cap | $329.17/MW-day RTO-wide, higher in constrained zones | Ratepayers, utilities, data center developers |
| Corporate credit | Hyperscaler multi-currency bond issuance | $5.7B Morgan Stanley bond; market-wide IG issuance pace | Bond investors, hyperscalers, banks structuring deals |
| Macro / Inflation | Sticky electricity inflation | Ratepayer exposure; utility capex pass-through | Consumers, long-duration investors |
| Sovereign demand | Japan's Treasury holdings | $1.2099T (Apr 2026) vs $1.1916T (Mar 2026), an increase | U.S. Treasury, long-duration borrowing costs |
Strategic Impact Matrix Addendum
Layer What is moving Primary signal Who is exposed Equipment supply chain Transformer and switchgear bottlenecks 80-210 week transformer lead-time range; 77% power-transformer cost increase since 2019 Data center developers, utilities, EPC contractors, infrastructure funds Curtailment risk PJM Connect and Manage / BYONG trade-off Curtailment exposure becomes an uptime and debt-service variable Data center sponsors, lenders, customers, insurers
Analyst Intelligence Box
The signal worth tracking is not any single data point above but the correlation between them: capacity prices, interconnection rulemaking, and hyperscaler bond issuance are all responding to the same underlying demand curve within the same several-week window. That is consistent with a genuine structural constraint rather than a temporary headline cluster. The Treasury and stablecoin data points are included specifically because they are the two areas most prone to overstated causal narratives in current commentary, and the verified data in both cases argues for caution.
Counter-Thesis
It is possible that capacity prices and interconnection bottlenecks are a transitional phase rather than a durable constraint. The deployment of Grid-Enhancing Technologies (GETs) and advanced conductors represents a tangible path to unlocking capacity. IEA Electricity 2026 gives the stronger current frame: non-firm connection agreements and grid-enhancing or upgrade technologies could unlock roughly 1,200-1,600 GW of hosting capacity for advanced-stage projects without waiting for conventional grid expansion alone.
Furthermore, an operational distinction is emerging between AI training and AI inference flexible loads:
- AI training workloads may be more interruptible, allowing for better grid integration.
- AI inference workloads are less interruptible as they serve live users.
This flexibility could alleviate peak stress if properly categorized and incentivized.
Break-This-Thesis
This thesis breaks if any of the following occur: PJM or another major RTO resolves large-load interconnection rules within the current 60-day FERC response window without material cost increases passed to data center customers; hyperscaler bond spreads stay flat or tighten despite rising issuance volume, indicating the market is not pricing in incremental risk; or Japan's Treasury holdings reverse into a multi-month decline, which would require new TIC data beyond the April 2026 figure verified here.
30/60/90 Watchlist
In the next 30 days: watch for the initial RTO/ISO responses and intervention filings in the FERC Section 206 show-cause dockets. In the next 60 days: watch for whether PJM, MISO, and the other named grid operators file tariff reforms or contest the FERC orders. In the next 90 days: watch the next monthly Treasury TIC release for whether Japan's April 2026 increase in Treasury holdings continues or reverses, and watch hyperscaler bond spreads for any repricing as issuance volumes continue to build.
Evidence Stack
- IEA - Energy and AI
- DOE / LBNL 2024 Report on U.S. Data Center Energy Use
- Goldman Sachs Research, US Data Center Power Demand Projected to Double by 2027
- FERC large-load interconnection show-cause orders / White & Case summary
- Heatmap, PJM data center demand vote / data center demand
- Utility Dive, ERCOT 438 GW large-load queue
- Morgan Stanley, Energy: Transitioning to Resilience
Internal Link Bridge
This piece extends SIAIntel's Dollar-Watt Loop frame by showing how AI infrastructure converts power scarcity into credit-market exposure.
Editorial Credit
This intelligence brief was prepared by the SIAIntel Editorial Desk.
Editorial oversight: Elanur Karahan, Founder & Editor-in-Chief
LinkedIn: View ProfileRelated Intelligence
Related intelligence in this category · 5 briefs
Japan’s Stablecoin Push Turns Sovereign Bonds Into the Next Crypto Battleground
Analysis of MUFG, SMBC, and Mizuho's 2027 stablecoin plans. Analyzing how digital yen reserves and on-chain repo could reshape JGB demand and Asian settlement rails.
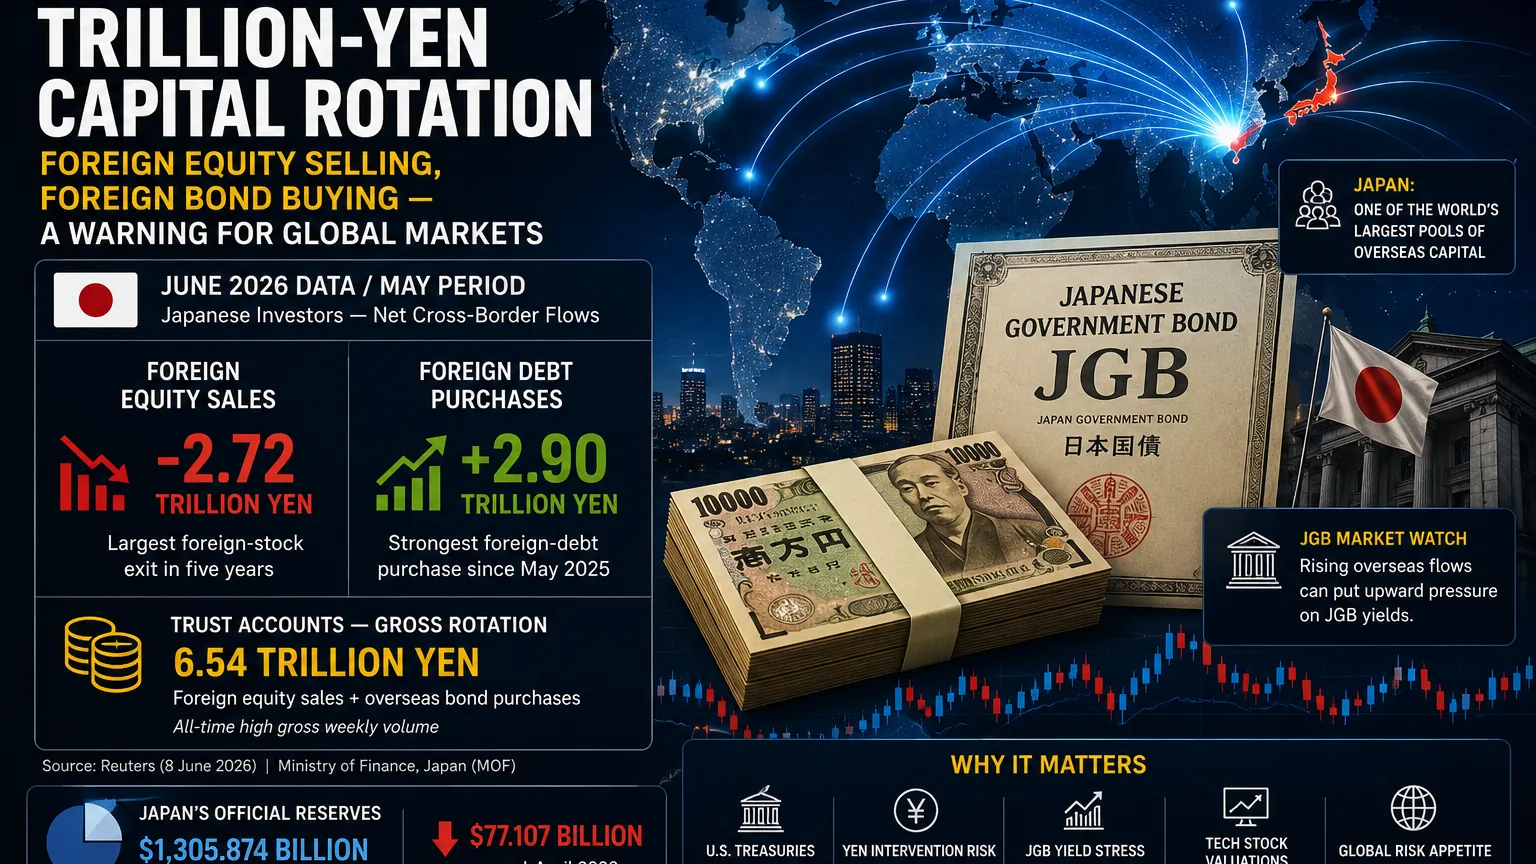
Japan’s Trillion-Yen Capital Rotation Sends a Warning Through Global Markets
Japanese investors sold foreign equities and bought foreign bonds in May, sending a warning through U.S. Treasuries, tech stocks, the yen and global risk appetite.
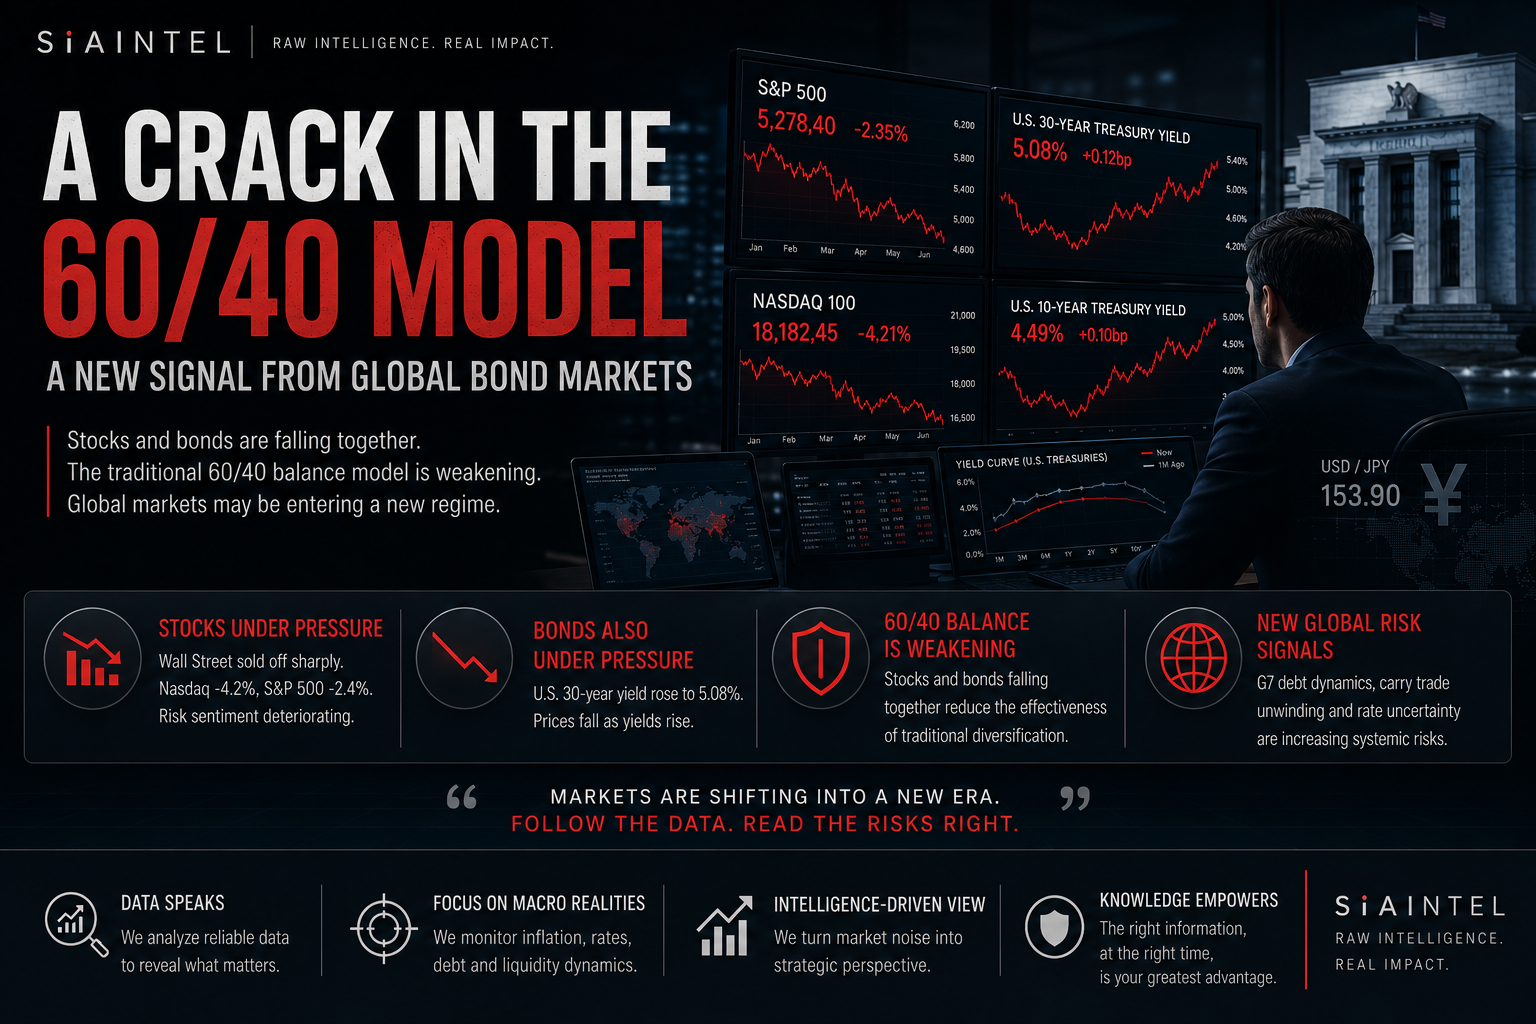
The 60/40 Breakdown: The Hidden Crack in Global Bond Markets
Treasuries are losing part of their hedge role as G7 debt stress, inflation risk and stock-bond correlation reshape global portfolio strategy.
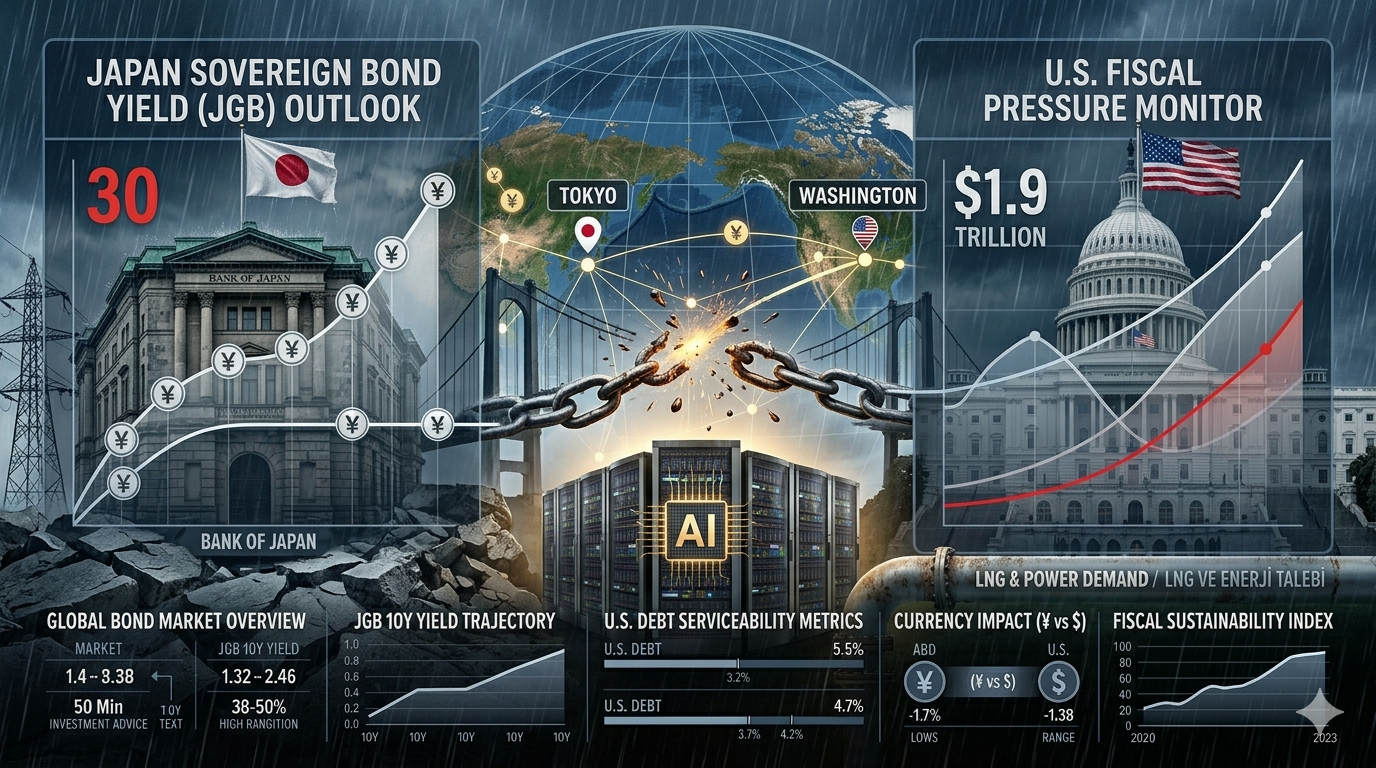
A 30-Year High and a $1.9 Trillion Deficit: How Japan's Bond Signal Is Feeding America's Fiscal Pressure
Japan's 30-year high bond yield and America's $1.9 trillion deficit projection are sending a global warning signal, from mortgages and pensions to emerging-market debt.

Fuel Pressure in the Skies: Why Flexible Tickets Are Becoming Travel Protection
Pressure in the jet fuel market could make flexibility, cancellation rights and safer connection times more important than simply choosing the cheapest ticket this summer.